TON/USDT Technical Analysis: Key Levels and Trade Ideas – Sep 9
In recent trading sessions, Toncoin (TON) has shown a surge in bullish activity, recovering from a previous downtrend and trading around $5.06, up by 3.48% over the past 24 hours. Despite enduring some negative sentiment in the market over the past months, which saw a sharp decline in the broader crypto market, TON/USDT has gained traction due to stronger demand. With volatility in cryptocurrencies fluctuating, understanding the short and medium-term price movements of Toncoin could provide actionable insights for traders seeking to optimize their positions.
1-Day Price Analysis
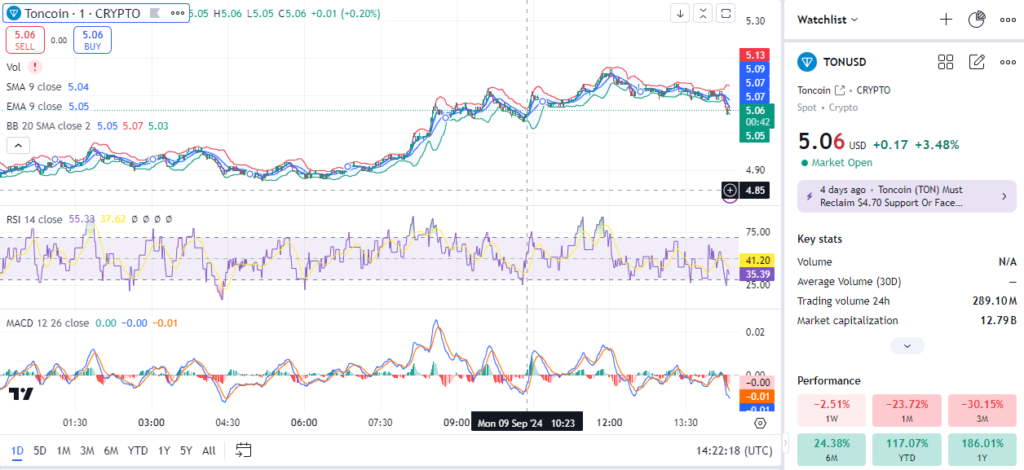
On the 1-day chart, Toncoin has been trading in a narrow range between $4.85 and $5.14. The Bollinger Bands (BB) indicator reveals a consolidation phase, with the price bouncing between the lower and middle bands, signaling that TON is gearing up for a potential breakout. The Simple Moving Average (SMA) of 9 and 20 periods stands at $5.04 and $5.05, respectively, indicating a close-knit range that suggests a period of indecision among traders. With the RSI (Relative Strength Index) at 55.33, the asset is in neutral territory, leaving room for a bullish push.
The Moving Average Convergence Divergence (MACD) indicator shows that the MACD line is close to crossing the signal line, with a histogram reading of -0.01. A positive crossover could signal the beginning of bullish momentum if confirmed by volume and price action. However, traders should keep a close watch on volume since the current trend is subdued, and low volume could result in a continuation of the sideways trend.

Read More: ETH/USDT Technical Analysis: Key Levels and Trade Ideas – Sep 8
5-Day Price Analysis
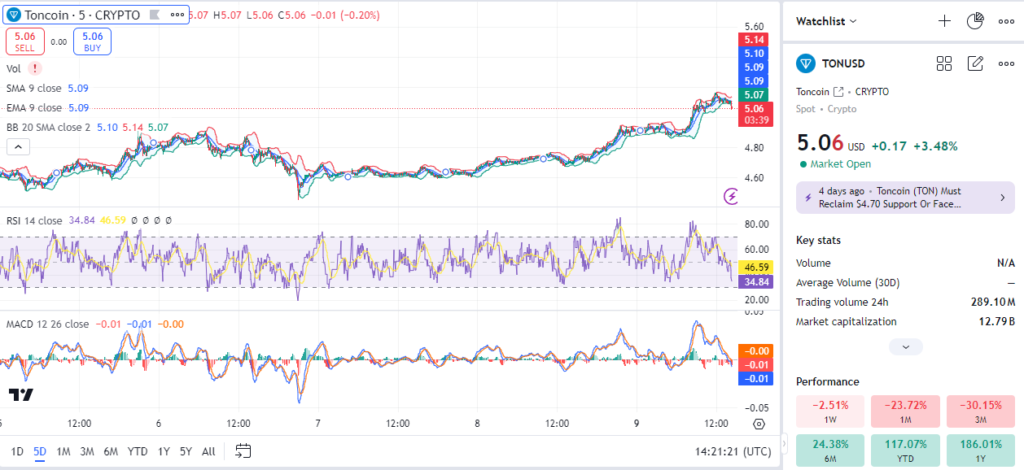
In the 5-day chart, TON/USDT demonstrates a more noticeable correction and rebound. The price has fluctuated from $4.80 up to a high of $5.14. The 9-period and 20-period SMA ($5.09 and $5.14) on the 5-day chart show that the short-term trend remains undecided, with slight bearish bias as the price currently trades just below these averages.
The RSI at 46.59 shows a more neutral stance compared to the 1-day chart, indicating that the asset is neither overbought nor oversold. This suggests that buyers are stepping in to prevent further declines, but sellers are still dominant. MACD on the 5-day chart is more neutral with the histogram slightly below zero (-0.01), and both the MACD and signal lines are hovering near equilibrium.
Price action shows that $4.85 acts as strong support, while the $5.14 resistance remains intact. For a sustainable move higher, TON would need to close above the $5.10-$5.14 region with strong volume, signaling renewed buyer interest.

Read More: BTC/USDT Technical Price Analysis: Trade Ideas – Sep 8
1-Month Price Analysis
Zooming out to the 1-month (1M) timeframe, the broader market view reveals significant price swings. Toncoin has experienced a wider range of volatility in the past 30 days, with the price reaching a low of $4.85 and a high of $5.21. The Bollinger Bands indicate more extended price movement as they expand, suggesting that volatility could remain high in the coming sessions.
The RSI reading of 58.67 is approaching the overbought territory, which might signal a reversal or consolidation soon. However, the MACD histogram reading at 0.06 and the MACD line above the signal line suggest that bullish momentum is building. The crossover that occurred about two weeks ago continues to give an upward bias to price action in the medium term.
The $5.20 region remains a strong resistance on the 1-month chart, while the $4.85 level has provided consistent support. A breakout above $5.20 could pave the way for further gains toward $5.50 or higher. Conversely, a drop below $4.85 could result in a retest of lower support levels near $4.60.

Trade Ideas and Strategy
Based on the technical indicators and current price structure of TON/USDT, several trade setups present themselves for different trading horizons:
Short-term Trade:
- Entry Point: Enter a long position at $5.06, near the current market price.
- Take Profit: The first target would be the resistance area of $5.14. If bullish momentum sustains, a second target at $5.20 can be considered.
- Stop Loss: Set a stop-loss at $4.85, just below the key support level. This ensures protection against downside volatility while leaving enough room for price fluctuations.
- Risk Management Tip: Limit the position size to 1-2% of total portfolio value to minimize risk, as the 1-day and 5-day charts suggest a period of indecision and low volume.
Medium-term Trade:
- Entry Point: A more patient strategy would be to wait for a confirmed breakout above $5.14.
- Take Profit: Target the $5.50 level, where historical price action suggests resistance, or $5.80 if the breakout is accompanied by a surge in volume.
- Stop Loss: Place a stop-loss at $4.85 to protect against false breakouts or market reversals.
- Risk Management Tip: Given the recent volatility, use a trailing stop-loss once the price reaches $5.20 to lock in profits while allowing for further upside potential.
Conclusion
Toncoin’s price action in recent days suggests that while there is bullish momentum building, the market is still in a phase of consolidation, with key support and resistance levels in play. In the short term, traders can look to take advantage of a potential breakout above $5.14, while keeping risk tightly managed with stop-loss levels at $4.85. The 1-month analysis provides a more bullish outlook, with the RSI nearing overbought conditions and the MACD indicating upward momentum. As always, managing risk and keeping an eye on market volumes will be critical to maximizing gains and minimizing losses.


